- Access the bounding dates of a grates object
- Epiweek class
- Is a date covered by a grouped date
- Accessors for grate objects
- Integer-period class (Experimental)
- ISO Week class
- Month class
- Period class
- Format and print a month object
- Print a period object
- Format and print a yearmonth object
- Epiweek scale
- Integer-period scale (Experimental)
- Isoweek scale
- Month scale
- Period scale
- Year scale
- Yearmonth scale
- Yearquarter scale
- Yearweek scale
- Year class
- Yearmonth class
- Yearquarter class
- Yearweek class
-- A --
as_epiweek()
as_epiweek.default()
as_epiweek.Date()
as_epiweek.POSIXt()
as_epiweek.character()
as_epiweek.factor()
as_int_period.default()
as_int_period.integer()
as_int_period.double()
as_int_period()
as_isoweek()
as_isoweek.default()
as_isoweek.Date()
as_isoweek.POSIXt()
as_isoweek.character()
as_isoweek.factor()
as_month()
as_month.default()
as_month.Date()
as_month.POSIXt()
as_month.character()
as_month.factor()
as_period()
as_period.default()
as_period.Date()
as_period.POSIXt()
as_period.character()
as_period.factor()
as_year()
as_year.default()
as_year.Date()
as_year.POSIXt()
as_year.character()
as_year.factor()
as_yearmonth()
as_yearmonth.default()
as_yearmonth.Date()
as_yearmonth.POSIXt()
as_yearmonth.character()
as_yearmonth.factor()
as_yearquarter()
as_yearquarter.default()
as_yearquarter.Date()
as_yearquarter.POSIXt()
as_yearquarter.character()
as_yearquarter.factor()
as_yearweek()
as_yearweek.default()
as_yearweek.Date()
as_yearweek.POSIXt()
as_yearweek.character()
as_yearweek.factor()
-- B --
boundaries
-- D --
date_start()
date_end()
-- E --
epiweek_class
epiweek()
-- F --
format.grates_month()
format.grates_period()
format.grates_yearmonth()
-- G --
grouped_date_accessors
get_firstday()
get_firstday.default()
get_firstday.grates_yearweek_monday()
get_firstday.grates_yearweek_tuesday()
get_firstday.grates_yearweek_wednesday()
get_firstday.grates_yearweek_thursday()
get_firstday.grates_yearweek_friday()
get_firstday.grates_yearweek_saturday()
get_firstday.grates_yearweek_sunday()
get_week()
get_week.default()
get_week.grates_yearweek()
get_week.grates_epiweek()
get_week.grates_isoweek()
get_year()
get_year.default()
get_year.grates_yearweek()
get_year.grates_epiweek()
get_year.grates_isoweek()
get_year.grates_yearmonth()
get_year.grates_yearquarter()
get_year.grates_year()
get_n()
get_n.default()
get_n.grates_month()
get_n.grates_period()
get_n.grates_int_period()
get_offset()
get_offset.default()
get_offset.grates_period()
-- I --
is_epiweek()
int_period_class
is_int_period()
isoweek_class
isoweek()
is_isoweek()
is_month()
is_period()
is_year()
is_yearmonth()
is_yearquarter()
is_yearweek()
-- M --
month_class
-- N --
new_epiweek()
new_int_period()
new_isoweek()
new_month()
new_period()
new_yearmonth()
new_yearquarter()
new_yearweek()
-- P --
period_class
print.grates_month()
print.grates_period()
print.grates_yearmonth()
-- S --
scale_x_grates_epiweek()
scale_x_grates_int_period()
scale_x_grates_isoweek()
scale_x_grates_month()
scale_x_grates_period()
scale_x_grates_year()
scale_x_grates_yearmonth()
scale_x_grates_yearquarter()
scale_x_grates_yearweek()
scale_x_grates_yearweek_monday()
scale_x_grates_yearweek_isoweek()
scale_x_grates_yearweek_tuesday()
scale_x_grates_yearweek_wednesday()
scale_x_grates_yearweek_thursday()
scale_x_grates_yearweek_friday()
scale_x_grates_yearweek_saturday()
scale_x_grates_yearweek_sunday()
scale_x_grates_yearweek_epiweek()
-- Y --
year_class
year()
yearmonth_class
yearmonth()
yearquarter_class
yearquarter()
yearweek_class
yearweek()
-- misc --
%during%()
Access the bounding dates of a grates object
Description
Utility functions for accessing the boundary dates for each element of a grates object.
Usage
date_start(x)

date_end(x)
Arguments
x |
grouped date vector. |
Value
The requested start and end dates for each element in the input.
Examples
dates <- as.Date("2020-01-01") + 1:9
week <- as_isoweek(dates)
date_start(week)
#> [1] "2019-12-30" "2019-12-30" "2019-12-30" "2019-12-30" "2020-01-06"
#> [6] "2020-01-06" "2020-01-06" "2020-01-06" "2020-01-06"
date_end(week)
#> [1] "2020-01-05" "2020-01-05" "2020-01-05" "2020-01-05" "2020-01-12"
#> [6] "2020-01-12" "2020-01-12" "2020-01-12" "2020-01-12"
period <- as_period(dates, n = 3)
date_start(period)
#> [1] "2019-12-31" "2020-01-03" "2020-01-03" "2020-01-03" "2020-01-06"
#> [6] "2020-01-06" "2020-01-06" "2020-01-09" "2020-01-09"
date_end(period)
#> [1] "2020-01-02" "2020-01-05" "2020-01-05" "2020-01-05" "2020-01-08"
#> [6] "2020-01-08" "2020-01-08" "2020-01-11" "2020-01-11"
Epiweek class
Description
Epiweeks are defined to start on a Sunday and span a 7 day period. Where they span calendar years, they are associated to the year which contains the majority of the week's days (i.e. the first epiweek a year is the one with at least four days in said year).
Internally, <grates_epiweek> objects are stored as the number of weeks
(starting at 0) from the first Sunday after the Unix Epoch (1970-01-01).
That is, the number of seven day periods from 1970-01-04.
Usage
epiweek(year = integer(), week = integer())

as_epiweek(x, ...)

## Default S3 method:
as_epiweek(x, ...)

## S3 method for class 'Date'
as_epiweek(x, ...)

## S3 method for class 'POSIXt'
as_epiweek(x, ...)

## S3 method for class 'character'
as_epiweek(x, format, tryFormats = c("%Y-%m-%d", "%Y/%m/%d"), ...)

## S3 method for class 'factor'
as_epiweek(x, format, tryFormats = c("%Y-%m-%d", "%Y/%m/%d"), ...)

new_epiweek(x = integer())

is_epiweek(xx)
Arguments
year |
Vector representing the year associated with
|
week |
Vector representing the week associated with 'year.
|
x, xx |
R objects. |
... |
Other values passed to as.Date(). |
format |
Passed to as.Date() unless If not specified, it will try tryFormats one by one on the first non-NA
element, and give an error if none works. Otherwise, the processing is via
|
tryFormats |
Format strings to try if format is not specified. |
Details
epiweek() is a constructor for <grates_epiweek> objects. It takes a
vector of year and vector of week values as inputs. Length 1 inputs will be
recycled to the length of the other input and double vectors will again be
converted to integer via as.integer(floor(x)).
as_epiweek() is a generic for conversion to <grates_epiweek>.
Date, POSIXct, and POSIXlt are converted with the timezone respected.
Character objects are first coerced to date via
as.Date()unlessformat = "yearweek"in which case input is assumed to be in the form "YYYY-Wxx" and parsed accordingly.
new_epiweek() is a minimal constructor for <grates_epiweek> objects
aimed at developers. It takes, as input, the number of epiweeks since the
sunday after the Unix Epoch that you wish to represent. double vectors will
be converted to integer via as.integer(floor(x)).
Value
A <grates_epiweek> object.
See Also
The yearweek and isoweek classes.
Examples
# date coercion
as_epiweek(Sys.Date())
#> <grates_epiweek[1]>
#> [1] "2025-W11"
# POSIXt coercion
as_epiweek(as.POSIXct("2019-03-04 01:01:01", tz = "America/New_York"))
#> <grates_epiweek[1]>
#> [1] "2019-W10"
# character coercion assumes date input by default
as_epiweek("2019-05-03")
#> <grates_epiweek[1]>
#> [1] "2019-W18"
# character coercion can handle YYYY-Www format too
as_epiweek("2019-W12", format = "yearweek")
#> <grates_epiweek[1]>
#> [1] "2019-W12"
# construction
epiweek(year = 2000, week = 3)
#> <grates_epiweek[1]>
#> [1] "2000-W03"
# direct construction
stopifnot(
    identical(
        new_epiweek(0:1),
        as_epiweek("1970-01-04") + 0:1
    )
)
Is a date covered by a grouped date
Description
%during% determines whether a supplied date is within the period covered
by each element of a grates object.
Usage
date %during% xArguments
date |
A scalar |
x |
grouped date vector. |
Value
A logical vector indicating whether the date was present within the range of the tested object.
Examples
dates <- as.Date("2020-01-01") + 1:10
week <- as_isoweek(dates)
dates[1] %during% week
#> [1] TRUE TRUE TRUE TRUE FALSE FALSE FALSE FALSE FALSE FALSE
period <- as_period(dates, n = 3)
dates[10] %during% period
#> [1] FALSE FALSE FALSE FALSE FALSE FALSE FALSE TRUE TRUE TRUE
Accessors for grate objects
Description
Generics and methods for accessing information about grouped date objects.
Usage
get_firstday(x, ...)

## Default S3 method:
get_firstday(x, ...)

## S3 method for class 'grates_yearweek_monday'
get_firstday(x, ...)

## S3 method for class 'grates_yearweek_tuesday'
get_firstday(x, ...)

## S3 method for class 'grates_yearweek_wednesday'
get_firstday(x, ...)

## S3 method for class 'grates_yearweek_thursday'
get_firstday(x, ...)

## S3 method for class 'grates_yearweek_friday'
get_firstday(x, ...)

## S3 method for class 'grates_yearweek_saturday'
get_firstday(x, ...)

## S3 method for class 'grates_yearweek_sunday'
get_firstday(x, ...)

get_week(x, ...)

## Default S3 method:
get_week(x, ...)

## S3 method for class 'grates_yearweek'
get_week(x, ...)

## S3 method for class 'grates_epiweek'
get_week(x, ...)

## S3 method for class 'grates_isoweek'
get_week(x, ...)

get_year(x, ...)

## Default S3 method:
get_year(x, ...)

## S3 method for class 'grates_yearweek'
get_year(x, ...)

## S3 method for class 'grates_epiweek'
get_year(x, ...)

## S3 method for class 'grates_isoweek'
get_year(x, ...)

## S3 method for class 'grates_yearmonth'
get_year(x, ...)

## S3 method for class 'grates_yearquarter'
get_year(x, ...)

## S3 method for class 'grates_year'
get_year(x, ...)

get_n(x, ...)

## Default S3 method:
get_n(x, ...)

## S3 method for class 'grates_month'
get_n(x, ...)

## S3 method for class 'grates_period'
get_n(x, ...)

## S3 method for class 'grates_int_period'
get_n(x, ...)

get_offset(x, ...)

## Default S3 method:
get_offset(x, ...)

## S3 method for class 'grates_period'
get_offset(x, ...)
Arguments
x |
R object |
... |
Not currently used |
Value
Requested value or an error if no method available.
Examples
dates <- as.Date("2020-01-01") + 1:14
dat <- as_isoweek(dates)
get_week(dat)
#> [1] 1 1 1 1 2 2 2 2 2 2 2 3 3 3
get_year(dat)
#> [1] 2020 2020 2020 2020 2020 2020 2020 2020 2020 2020 2020 2020 2020 2020
Integer-period class (Experimental)
Description
<grates_int_period> objects represent groupings of n consecutive integers
from 0.
Usage
## Default S3 method:
as_int_period(x, n = 1L, ...)

## S3 method for class 'integer'
as_int_period(x, n = 1L, ...)

## S3 method for class 'double'
as_int_period(x, n = 1L, ...)

new_int_period(x = integer(), n = 1L)

is_int_period(xx)

as_int_period(x, n, ...)
Arguments
x, xx |
R objects. For For
|
n |
Number of integers that are being grouped. Must be greater than 0. |
... |
Not currently used. |
Details
as_int_period() is a generic for coercing input in to <grates_int_period>
objects. For numeric input it coerces it's input x first via
x <- as.integer(floor(x)) and then via integer division by n (i.e.
x %/% n).
new_int_period() is a minimal constructor for <grates_period>
objects aimed at developers. It takes, as input, the number of integer
periods and the value of n.
Value
A <grates_int_period> object.
Examples
# coercion
as_int_period(1:10, n = 3)
#> <grates_int_period[10]>
#>  [1] [0, 2]  [0, 2]  [3, 5]  [3, 5]  [3, 5]  [6, 8]  [6, 8]  [6, 8]  [9, 11]
#> [10] [9, 11]
# direct construction
stopifnot(
    identical(
        as_int_period(1:10, n = 3),
        new_int_period(c(0, 0, 1, 1, 1, 2, 2, 2, 3, 3), n = 3)
    )
)
ISO Week class
Description
<grates_isoweek> objects are used to represent ISO week dates as defined in
ISO 8601. To expand further, it is
easiest to quote from the related
wikipedia entry:
"ISO weeks start with Monday and end on Sunday. Each week's year is the Gregorian year in which the Thursday falls. The first week of the year, hence, always contains 4 January. ISO week year numbering therefore usually deviates by 1 from the Gregorian for some days close to 1 January."
Internally, <grates_isoweek> objects are stored as the number of weeks
(starting at 0) from the first Monday prior to the Unix Epoch (1970-01-01).
That is, the number of seven day periods from 1969-12-29.
Usage
isoweek(year = integer(), week = integer())

as_isoweek(x, ...)

## Default S3 method:
as_isoweek(x, ...)

## S3 method for class 'Date'
as_isoweek(x, ...)

## S3 method for class 'POSIXt'
as_isoweek(x, ...)

## S3 method for class 'character'
as_isoweek(x, format, tryFormats = c("%Y-%m-%d", "%Y/%m/%d"), ...)

## S3 method for class 'factor'
as_isoweek(x, format, tryFormats = c("%Y-%m-%d", "%Y/%m/%d"), ...)

new_isoweek(x = integer())

is_isoweek(xx)
Arguments
year |
Vector representing the year associated with
|
week |
Vector representing the week associated with 'year.
|
x, xx |
R objects. |
... |
Other values passed to as.Date(). |
format |
Passed to as.Date() unless If not specified, it will try tryFormats one by one on the first non-NA
element, and give an error if none works. Otherwise, the processing is via
|
tryFormats |
Format strings to try if format is not specified. |
Details
isoweek() is a constructor for <grates_isoweek> objects. It takes a
vector of year and vector of week values as inputs. Length 1 inputs will be
recycled to the length of the other input and double vectors will again be
converted to integer via as.integer(floor(x)).
as_isoweek() is a generic for conversion to <grates_isoweek>.
Date, POSIXct, and POSIXlt are converted with the timezone respected.
Character objects are first coerced to date via
as.Date()unlessformat = "yearweek"in which case input is assumed to be in the form "YYYY-Wxx" and parsed accordingly.
new_isoweek() is a minimal constructor for <grates_isoweek> objects
aimed at developers. It takes, as input, the number of isoweeks since the
Monday prior to the Unix Epoch that you wish to represent. double vectors
will be converted to integer via as.integer(floor(x)).
Value
A <grates_isoweek> object.
References
Wikipedia contributors. (2025, January 15). ISO week date. In Wikipedia, The Free Encyclopedia. Retrieved 09:19, March 6, 2025, from https://en.wikipedia.org/w/index.php?title=ISO_week_date&oldid=1269568343
See Also
The yearweek and epiweek classes.
Examples
# date coercion
as_isoweek(Sys.Date())
#> <grates_isoweek[1]>
#> [1] "2025-W11"
# POSIXt coercion
as_isoweek(as.POSIXct("2019-03-04 01:01:01", tz = "America/New_York"))
#> <grates_isoweek[1]>
#> [1] "2019-W10"
# character coercion assumes date input by default
as_isoweek("2019-05-03")
#> <grates_isoweek[1]>
#> [1] "2019-W18"
# character coercion can handle YYYY-Www format too
as_isoweek("2019-W12", format = "yearweek")
#> <grates_isoweek[1]>
#> [1] "2019-W12"
# construction
isoweek(year = 2000, week = 3)
#> <grates_isoweek[1]>
#> [1] "2000-W03"
# direct construction
stopifnot(
    identical(
        new_isoweek(0:1),
        as_isoweek("1969-12-29") + 0:1
    )
)
Month class
Description
Month objects are groupings of 'n consecutive months' stored relative to the
Unix Epoch. More precisely, grates_month objects are stored as the integer
number (starting at 0), of n-month groups since the Unix Epoch (1970-01-01).
Usage
as_month(x, n, ...)

## Default S3 method:
as_month(x, n, ...)

## S3 method for class 'Date'
as_month(x, n, ...)

## S3 method for class 'POSIXt'
as_month(x, n, ...)

## S3 method for class 'character'
as_month(x, n, ...)

## S3 method for class 'factor'
as_month(x, n, ...)

new_month(x = integer(), n)

is_month(xx)
Arguments
x, xx |
R objects. |
n |
Number of months that are being grouped. Must be greater than 1 (use
|
... |
Only used For character input where additional arguments are passed through
to |
Details
as_month() is a generic for conversion to <grates_month>.
Character input is first parsed using
as.Date().POSIXt inputs are converted with the timezone respected.
Precision is only to the month level (i.e. the day of the month is always dropped).
new_month() is a minimal constructor for <grates_month> objects
aimed at developers. It takes, as input x, the number of n-months since
the Unix Epoch (1970-01-01) and the related value of n.
double vectors will be converted via as.integer(floor(x)).
Value
A <grates_month> object.
References
The algorithm to convert between dates and months relative to the UNIX Epoch comes from the work of Davis Vaughan in the unreleased datea package.
See Also
The yearmonth class.
Examples
# date coercion
as_month(Sys.Date(), n = 2)
#> <grates_month[1]>
#> [1] "2025-Mar to 2025-Apr"
# character coercion
as_month("2019-05-03", n = 4)
#> <grates_month[1]>
#> [1] "2019-May to 2019-Aug"
# POSIXt coercion
as_month(as.POSIXct("2019-03-04 01:01:01", tz = "America/New_York"), n = 2)
#> <grates_month[1]>
#> [1] "2019-Mar to 2019-Apr"
# direct construction
d <- seq.Date(from = as.Date("1970-03-01"), by = "2 month", length.out = 10)
stopifnot(
    identical(
        as_month(d, n = 2),
        new_month(1:10, 2)
    )
)
Period class
Description
<grates_period> objects represent groupings of n consecutive days
calculated relative to an offset. It is useful for when you wish to group
an arbitrary number of dates together (e.g. 10 days).
Usage
as_period(x, n, ...)

## Default S3 method:
as_period(x, n = 1L, offset = 0L, ...)

## S3 method for class 'Date'
as_period(x, n = 1L, offset = 0L, ...)

## S3 method for class 'POSIXt'
as_period(x, n = 1L, offset = 0L, ...)

## S3 method for class 'character'
as_period(x, n = 1L, offset = 0L, ...)

## S3 method for class 'factor'
as_period(x, n = 1L, offset = 0L, ...)

new_period(x = integer(), n = 1L, offset = 0L)

is_period(xx)
Arguments
x, xx |
R objects. For For |
n |
Number of days that are being grouped. |
... |
Only used for character input where additional arguments are passed through
to |
offset |
Value you wish to start counting periods from relative to the Unix Epoch:
|
Details
Internally grates_period objects are stored as the integer number, starting
at 0, of periods since the Unix Epoch (1970-01-01) and a specified offset. Here
periods are taken to mean groupings of n consecutive days. For storage and
calculation purposes, offset is scaled relative to n
(i.e. offset <- offset %% n) and values of x stored relative to this
scaled offset.
as_period() is a generic for coercing input in to <grates_period> objects.
It is the recommended way for constructing period objects as it allows the
offset to be specified as a date (rather than an integer value relative to
the Unix Epoch).
Character input is first parsed using
as.Date().POSIXct and POSIXlt are converted with their timezone respected.
new_period() is a minimal constructor for <grates_period>
objects aimed at developers. It takes, as input, the number of periods since
the Unix Epoch and the specified offset. double vectors will
be converted via as.integer(floor(x)).
Value
A <grates_period> object.
Examples
# coercion from date
dat <- as.Date("2012-12-01")
as_period(dat + 0:3, n = 2, offset = dat)
#> <grates_period[4]>
#> [1] "2012-12-01 to 2012-12-02" "2012-12-01 to 2012-12-02"
#> [3] "2012-12-03 to 2012-12-04" "2012-12-03 to 2012-12-04"
# direct construction
new_period(1:10)
#> <grates_period[10]>
#>  [1] "1970-01-02" "1970-01-03" "1970-01-04" "1970-01-05" "1970-01-06"
#>  [6] "1970-01-07" "1970-01-08" "1970-01-09" "1970-01-10" "1970-01-11"
Format and print a month object
Description
Format and print a month object
Usage
## S3 method for class 'grates_month'
print(x, format = "%Y-%b", sep = "to", ...)

## S3 method for class 'grates_month'
format(x, format = "%Y-%b", sep = "to", ...)
Arguments
x |
A |
format |
The format to use for the bounds of each value. |
sep |
Where more than one month is grouped with others, |
... |
Not currently used. |
Value
For format(), a character vector representing the formatted input.
print() is called for the side effect of printing to screen and thus
returns the input <grates_month> object invisibly.
Print a period object
Description
Print a period object
Usage
## S3 method for class 'grates_period'
print(x, format = "%Y-%m-%d", sep = "to", ...)

## S3 method for class 'grates_period'
format(x, format = "%Y-%m-%d", sep = "to", ...)
Arguments
x |
A |
format |
The format to use for the bounds of each value. |
sep |
Where more than one day is grouped with others, |
... |
Not currently used. |
Format and print a yearmonth object
Description
Format and print a yearmonth object
Usage
## S3 method for class 'grates_yearmonth'
print(x, format = "%Y-%b", ...)

## S3 method for class 'grates_yearmonth'
format(x, format = "%Y-%b", ...)
Arguments
x |
A |
format |
The format to use for printing. |
... |
Not currently used. |
Value
For format(), a character vector representing the formatted input.
print() is called for the side effect of printing to screen and thus
returns the input <grates_yearmonth> object invisibly.
Epiweek scale
Description
ggplot2 scale for an <grates_epiweek> vector.
Usage
scale_x_grates_epiweek(
  ...,
  breaks = ggplot2::waiver(),
  n.breaks = 6L,
  format = NULL
)
Arguments
... |
Not currently used. |
breaks |
A |
n.breaks |
Approximate number of breaks calculated using Will only have an effect if |
format |
Format to use if "Date" scales are required. If NULL (default) then labels are in the standard epiweek format (YYYY-Www). If "week" then the labels are of the form Www (e.g. W37). Otherwise the value is used by |
Value
A scale for use with ggplot2.
Examples
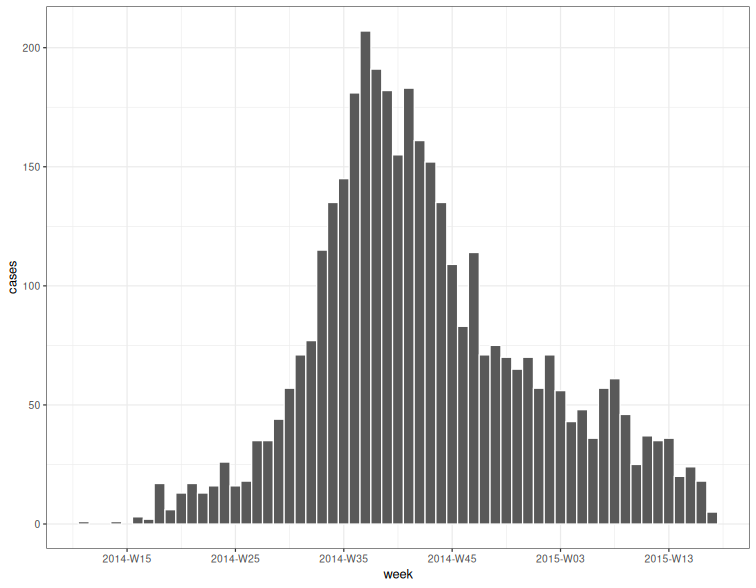
# use simulated linelist data from the outbreaks package
linelist <- outbreaks::ebola_sim_clean$linelist
x <- as_epiweek(linelist$date_of_infection)
dat <- aggregate(list(cases = x), by = list(week = x), FUN = length)

# plot the output
(week_plot <-
    ggplot2::ggplot(dat, ggplot2::aes(week, cases)) +
    ggplot2::geom_col(width = 1, colour = "white") +
    ggplot2::theme_bw())
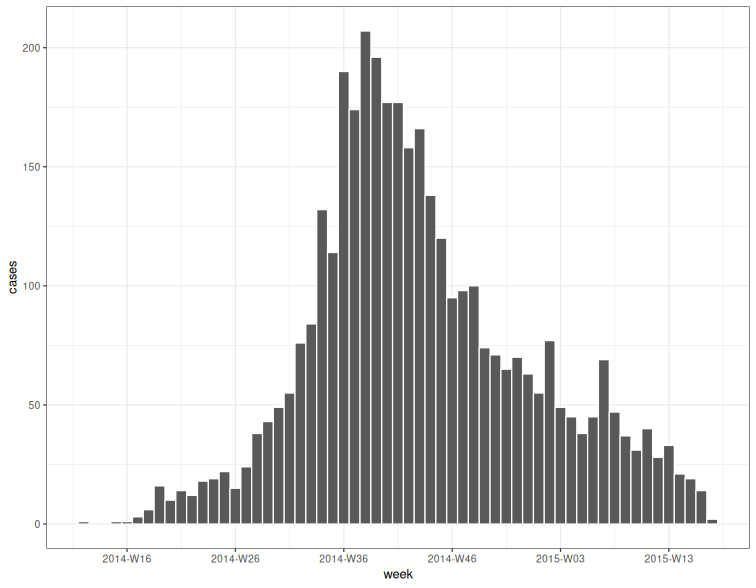
# We can have non-centred date labels on the x_axis by using the
# associated scale function and explicitly specifying a format for
# the date labels:
week_plot + scale_x_grates_epiweek(format = "%Y-%m-%d")

Integer-period scale (Experimental)
Description
ggplot2 scale for an integer-period vector.
Usage
scale_x_grates_int_period(
  ...,
  breaks = ggplot2::waiver(),
  n.breaks = 6L,
  centre = FALSE,
  n
)
Arguments
... |
Not currently used. |
breaks |
A |
n.breaks |
Approximate number of breaks calculated using Will only have an effect if |
centre |
Only applicable to an If FALSE labels are place at the edge of the bounds. If TRUE then labels are centralised and of the form |
n |
Number used for the original grouping. |
Value
A scale for use with ggplot2.
Isoweek scale
Description
ggplot2 scale for an <grates_isoweek> vector.
Usage
scale_x_grates_isoweek(
  ...,
  breaks = ggplot2::waiver(),
  n.breaks = 6L,
  format = NULL
)
Arguments
... |
Not currently used. |
breaks |
A |
n.breaks |
Approximate number of breaks calculated using Will only have an effect if |
format |
Format to use if "Date" scales are required. If NULL (default) then labels are in the standard isoweek format (YYYY-Www). If "week" then the labels are of the form Www (e.g. W37). Otherwise the value is used by |
Value
A scale for use with ggplot2.
Examples
# use simulated linelist data from the outbreaks package
linelist <- outbreaks::ebola_sim_clean$linelist
x <- as_isoweek(linelist$date_of_infection)
dat <- aggregate(list(cases = x), by = list(week = x), FUN = length)

# plot the output
(week_plot <-
    ggplot2::ggplot(dat, ggplot2::aes(week, cases)) +
    ggplot2::geom_col(width = 1, colour = "white") +
    ggplot2::theme_bw())

# We can have non-centred date labels on the x_axis by using the
# associated scale function and explicitly specifying a format for
# the date labels:
week_plot + scale_x_grates_isoweek(format = "%Y-%m-%d")

Month scale
Description
ggplot2 scale for a month vector.
Usage
scale_x_grates_month(
  ...,
  breaks = ggplot2::waiver(),
  n.breaks = 6L,
  format = "%Y-%m-%d",
  bounds_format = "%Y-%b",
  sep = "to",
  n
)
Arguments
... |
Not currently used. |
breaks |
A |
n.breaks |
Approximate number of breaks calculated using Will only have an effect if |
format |
Format to use if "Date" scales are required. If NULL then labels are centralised and of the form "lower category bound to upper category bound". If not NULL then the value is used by |
bounds_format |
Format to use for grouped date labels. Only used if |
sep |
Separator to use for grouped date labels. |
n |
Number of months used for the original grouping. |
Value
A scale for use with ggplot2.
Examples
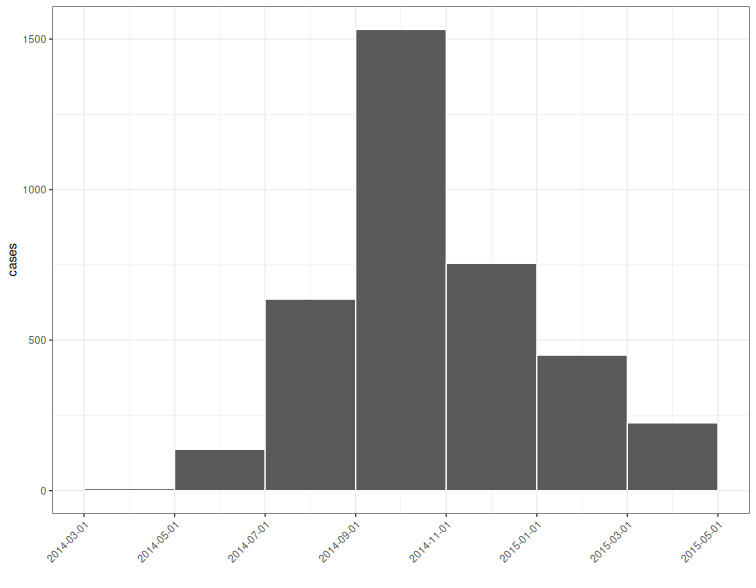
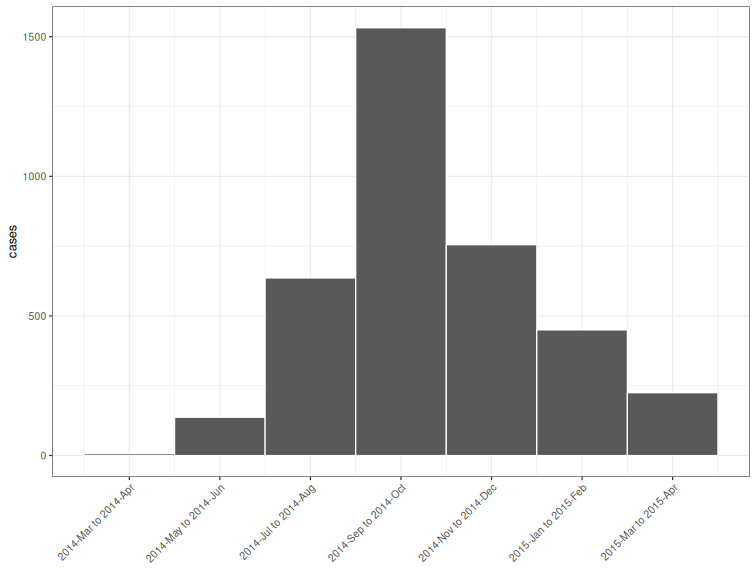
# use simulated linelist data from the outbreaks package
linelist <- outbreaks::ebola_sim_clean$linelist

# calculate the bimonthly number of cases
x <- as_month(linelist$date_of_infection, n = 2)
(dat <- aggregate(list(cases = x), by = list(group = x), FUN = length))
#>                  group cases
#> 1 2014-Mar to 2014-Apr     7
#> 2 2014-May to 2014-Jun   137
#> 3 2014-Jul to 2014-Aug   636
#> 4 2014-Sep to 2014-Oct  1532
#> 5 2014-Nov to 2014-Dec   755
#> 6 2015-Jan to 2015-Feb   450
#> 7 2015-Mar to 2015-Apr   225
# by default lower date bounds are used for the x axis
(bimonth_plot <-
    ggplot2::ggplot(dat, ggplot2::aes(group, cases)) +
    ggplot2::geom_col(width = 1, colour = "white") +
    ggplot2::theme_bw() +
    ggplot2::theme(
        axis.text.x = ggplot2::element_text(
            angle = 45,
            hjust = 1
        )
    ) +
    ggplot2::xlab(""))
# To obtain centred labels you must explicitly set the format to NULL
# in the scale:
bimonth_plot + scale_x_grates_month(format = NULL, n = 2)
Period scale
Description
ggplot2 scale for an <grates_period> vector.
Usage
scale_x_grates_period(
  ...,
  breaks = ggplot2::waiver(),
  n.breaks = 6L,
  format = "%Y-%m-%d",
  n,
  offset
)
Arguments
... |
Not currently used. |
breaks |
A |
n.breaks |
Approximate number of breaks calculated using Will only have an effect if |
format |
Format to use for dates. Value is used by |
n |
Number of days in each period. |
offset |
Number of days used in original grouping for the offset from the Unix Epoch. |
Value
A scale for use with ggplot2.
Examples
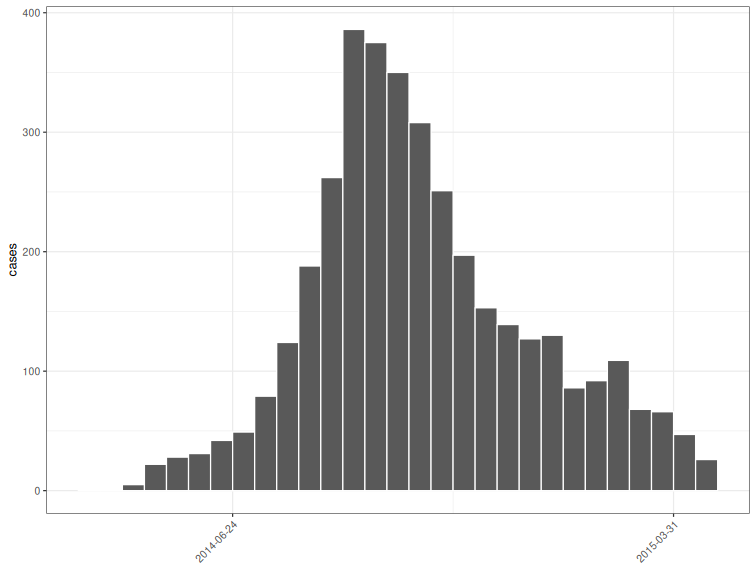
# use simulated linelist data from the outbreaks package
linelist <- outbreaks::ebola_sim_clean$linelist

# Calculate the total of infections across 14 day periods offset from
# the first date
x <- linelist$date_of_infection
x <- as_period(x, n = 14, offset = min(x, na.rm = TRUE))
dat <- aggregate(list(cases = x), by = list(period = x), FUN = length)
head(dat)
#>                     period cases
#> 1 2014-03-19 to 2014-04-01     1
#> 2 2014-04-02 to 2014-04-15     1
#> 3 2014-04-16 to 2014-04-29     5
#> 4 2014-04-30 to 2014-05-13    22
#> 5 2014-05-14 to 2014-05-27    28
#> 6 2014-05-28 to 2014-06-10    31
(period_plot <- ggplot2::ggplot(dat, ggplot2::aes(period, cases)) +
    ggplot2::geom_col(width = 1, colour = "white") +
    ggplot2::theme_bw() +
    ggplot2::theme(
        axis.text.x = ggplot2::element_text(
            angle = 45,
            hjust = 1
        )
    ) +
    ggplot2::xlab(""))

# To change defaults we must explicitly state the value of n and
# offset when calling the scale function
period_plot + scale_x_grates_period(
    n.breaks = 2,
    n = 14,
    offset = min(x, na.rm = TRUE)
)
Year scale
Description
ggplot2 scale for year vector.
Usage
scale_x_grates_year(
  ...,
  breaks = ggplot2::waiver(),
  n.breaks = 6L,
  format = NULL
)
Arguments
... |
Not currently used. |
breaks |
A |
n.breaks |
Approximate number of breaks calculated using Will only have an effect if |
format |
Format to use if "Date" scales are required. If not NULL then the value is used by |
Value
A scale for use with ggplot2.
Examples
# use simulated linelist data from the outbreaks package
linelist <- outbreaks::ebola_sim_clean$linelist

# calculate yearly cases by date of infection
x <- as_year(linelist$date_of_infection)
(dat <- aggregate(list(cases = x), by = list(year = x), FUN = length))
#>   year cases
#> 1 2014  3067
#> 2 2015   675
# by default labels are centred
(year_plot <-
    ggplot2::ggplot(dat, ggplot2::aes(year, cases)) +
    ggplot2::geom_col(width = 1, colour = "white") +
    ggplot2::theme_bw() +
    ggplot2::xlab(""))
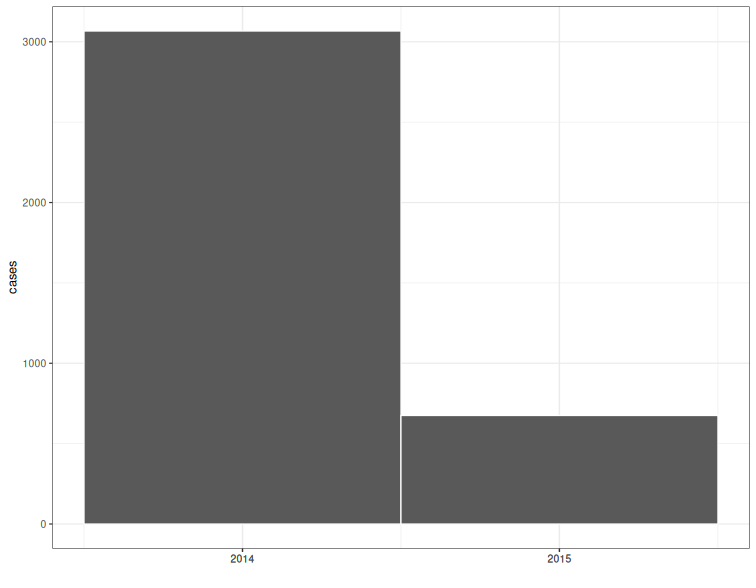
# To obtain centred labels you must explicitly set a date format
# in the scale:
year_plot + scale_x_grates_year(format = "%Y-%m-%d")

Yearmonth scale
Description
ggplot2 scale for a yearmonth vector.
Usage
scale_x_grates_yearmonth(
  ...,
  breaks = ggplot2::waiver(),
  n.breaks = 6L,
  format = NULL
)
Arguments
... |
Not currently used. |
breaks |
A |
n.breaks |
Approximate number of breaks calculated using Will only have an effect if |
format |
Format to use if "Date" scales are required. If not NULL then the value is used by |
Value
A scale for use with ggplot2.
Yearquarter scale
Description
ggplot2 scale for a yearquarter vector.
Usage
scale_x_grates_yearquarter(
  ...,
  breaks = ggplot2::waiver(),
  n.breaks = 6L,
  format = NULL
)
Arguments
... |
Not currently used. |
breaks |
A |
n.breaks |
Approximate number of breaks calculated using Will only have an effect if |
format |
Format to use if "Date" scales are required. If not NULL then the value is used by |
Value
A scale for use with ggplot2.
Examples
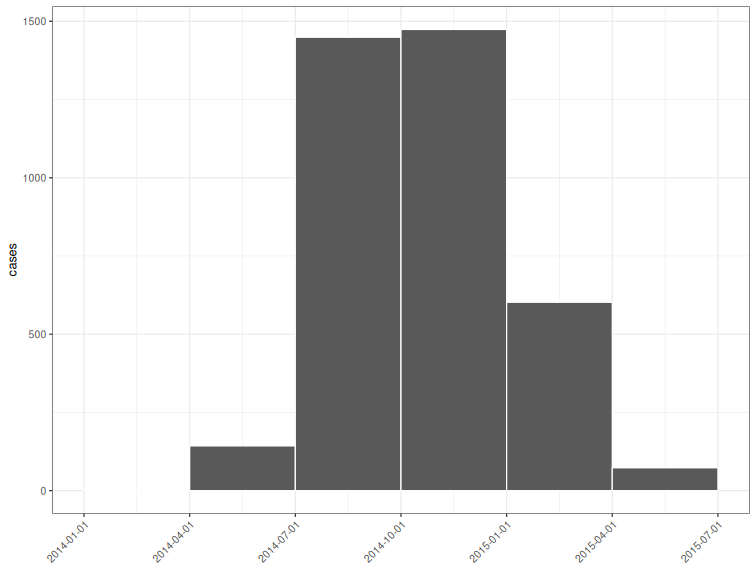
# use simulated linelist data from the outbreaks package
linelist <- outbreaks::ebola_sim_clean$linelist

# calculate quarterly cases by date of infection
x <- as_yearquarter(linelist$date_of_infection)
(dat <- aggregate(list(cases = x), by = list(quarter = x), FUN = length))
#>   quarter cases
#> 1 2014-Q1     1
#> 2 2014-Q2   143
#> 3 2014-Q3  1449
#> 4 2014-Q4  1474
#> 5 2015-Q1   602
#> 6 2015-Q2    73
# by default labels are centred
(quarter_plot <-
    ggplot2::ggplot(dat, ggplot2::aes(quarter, cases)) +
    ggplot2::geom_col(width = 1, colour = "white") +
    ggplot2::theme_bw() +
    ggplot2::theme(
        axis.text.x = ggplot2::element_text(
            angle = 45,
            hjust = 1
        )
    ) +
    ggplot2::xlab(""))
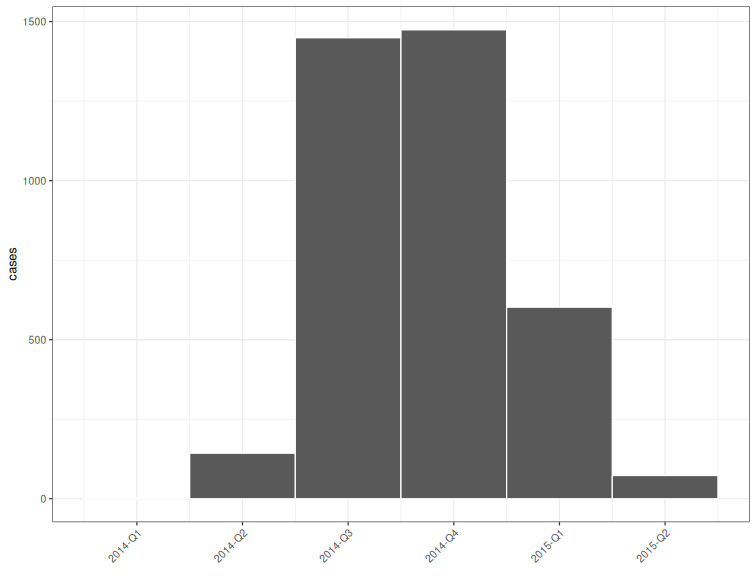
# To obtain centred labels you must explicitly set a date format
# in the scale:
quarter_plot + scale_x_grates_yearquarter(format = "%Y-%m-%d")
Yearweek scale
Description
ggplot2 scale for an <grates_yearweek> vector.
Usage
scale_x_grates_yearweek(
  ...,
  breaks = ggplot2::waiver(),
  n.breaks = 6L,
  firstday,
  format = NULL
)

scale_x_grates_yearweek_monday(
  ...,
  breaks = ggplot2::waiver(),
  n.breaks = 6,
  format = NULL
)

scale_x_grates_yearweek_isoweek(
  ...,
  breaks = ggplot2::waiver(),
  n.breaks = 6,
  format = NULL
)

scale_x_grates_yearweek_tuesday(
  ...,
  breaks = ggplot2::waiver(),
  n.breaks = 6,
  format = NULL
)

scale_x_grates_yearweek_wednesday(
  ...,
  breaks = ggplot2::waiver(),
  n.breaks = 6,
  format = NULL
)

scale_x_grates_yearweek_thursday(
  ...,
  breaks = ggplot2::waiver(),
  n.breaks = 6,
  format = NULL
)

scale_x_grates_yearweek_friday(
  ...,
  breaks = ggplot2::waiver(),
  n.breaks = 6,
  format = NULL
)

scale_x_grates_yearweek_saturday(
  ...,
  breaks = ggplot2::waiver(),
  n.breaks = 6,
  format = NULL
)

scale_x_grates_yearweek_sunday(
  ...,
  breaks = ggplot2::waiver(),
  n.breaks = 6,
  format = NULL
)

scale_x_grates_yearweek_epiweek(
  ...,
  breaks = ggplot2::waiver(),
  n.breaks = 6,
  format = NULL
)
Arguments
... |
Not currently used. |
breaks |
A |
n.breaks |
Approximate number of breaks calculated using Will only have an effect if |
firstday |
Integer value of the first weekday: 1 (Monday) to 7 (Sunday). |
format |
Format to use if "Date" scales are required. If NULL (default) then labels are in the standard yearweek format (YYYY-Www). If "week" then the labels are of the form Www (e.g. W37). Otherwise the value is used by |
Value
A scale for use with ggplot2.
Examples
# use simulated linelist data from the outbreaks package
linelist <- outbreaks::ebola_sim_clean$linelist
x <- as_yearweek(linelist$date_of_infection, firstday = 4)
dat <- aggregate(list(cases = x), by = list(week = x), FUN = length)

# plot the output
(week_plot <-
    ggplot2::ggplot(dat, ggplot2::aes(week, cases)) +
    ggplot2::geom_col(width = 1, colour = "white") +
    ggplot2::theme_bw())
# We can have non-centred date labels on the x_axis by using the
# associated scale function and explicitly specifying a format for the
# date labels and a value for firstday:
week_plot + scale_x_grates_yearweek(format = "%Y-%m-%d", firstday = 4)

Year class
Description
Years are represented by a <grates_year> object.
Usage
year(x = integer())

as_year(x, ...)

## Default S3 method:
as_year(x, ...)

## S3 method for class 'Date'
as_year(x, ...)

## S3 method for class 'POSIXt'
as_year(x, ...)

## S3 method for class 'character'
as_year(x, ...)

## S3 method for class 'factor'
as_year(x, ...)

is_year(object)
Arguments
x, object |
R objects. |
... |
Only used For character input where additional arguments are passed through
to |
Details
year() takes as input a vector representing, unsurprisingly, the years.
double vectors are coerced via as.integer(floor(x)).
as_yearquarter() is a generic for coercing input in to <grates_year>.
Character input is first parsed using
as.Date().POSIXct and POSIXlt are converted with their timezone respected.
Value
A <grates_year> object.
Examples
# date coercion
as_year(Sys.Date())
#> <grates_year[1]>
#> [1] 2025
# POSIXt coercion
as_year(as.POSIXct("2019-03-04 01:01:01", tz = "America/New_York"))
#> <grates_year[1]>
#> [1] 2019
# Character coercion
as_year("2019-05-03")
#> <grates_year[1]>
#> [1] 2019
# direct construction
year(2011:2020)
#> <grates_year[10]>
#>  [1] 2011 2012 2013 2014 2015 2016 2017 2018 2019 2020
Yearmonth class
Description
<grates_yearmonth> objects represent, unsurprisingly, years and associated months.
Internally they are stored as the number of months (starting at 0) since the
Unix Epoch (1970-01-01). Precision is only to the month level (i.e. the day
of the month is always dropped).
Usage
yearmonth(year = integer(), month = integer())

as_yearmonth(x, ...)

## Default S3 method:
as_yearmonth(x, ...)

## S3 method for class 'Date'
as_yearmonth(x, ...)

## S3 method for class 'POSIXt'
as_yearmonth(x, ...)

## S3 method for class 'character'
as_yearmonth(x, ...)

## S3 method for class 'factor'
as_yearmonth(x, ...)

new_yearmonth(x = integer())

is_yearmonth(xx)
Arguments
year |
Vector representing the year associated with
|
month |
Vector representing the month associated with
|
x, xx |
R objects. |
... |
Only used for character input where additional arguments are passed through
to |
Details
yearmonth() is a constructor for <grates_yearmonth> objects. It takes a
vector of year and a vector of month values as inputs. Length 1 inputs will
be recycled to the length of the other input and double vectors will
be converted to integer via as.integer(floor(x)).
as_yearmonth() is a generic for coercing input in to <grates_yearmonth>.
Character input is first parsed using
as.Date().POSIXct and POSIXlt are converted with their timezone respected.
new_yearmonth() is a minimal constructor for <grates_yearmonth> objects
aimed at developers. It takes, as input, the number of months (starting at 0)
since the Unix Epoch, that you wish to represent. double vectors will again
be converted to integer via as.integer(floor(x)).
Value
A <grates_yearmonth> object.
References
The algorithm to convert between dates and months relative to the UNIX Epoch comes from the work of Davis Vaughan in the unreleased datea package
See Also
new_month() and as_month() and for grouping of consecutive months.
Examples
# date coercion
as_yearmonth(Sys.Date())
#> <grates_yearmonth[1]>
#> [1] "2025-Mar"
# POSIXt coercion
as_yearmonth(as.POSIXct("2019-03-04 01:01:01", tz = "America/New_York"))
#> <grates_yearmonth[1]>
#> [1] "2019-Mar"
# character coercion
as_yearmonth("2019-05-03")
#> <grates_yearmonth[1]>
#> [1] "2019-May"
# construction
yearmonth(year = 2000, month = 3)
#> <grates_yearmonth[1]>
#> [1] "2000-Mar"
# direct construction
d <- seq.Date(from = as.Date("1970-01-01"), by = "month", length.out = 10)
stopifnot(
    identical(
        as_yearmonth(d),
        new_yearmonth(0:9)
    )
)
Yearquarter class
Description
<grates_yearquarter> objects represent years and associated quarters
Internally they are stored as the number of quarters (starting at 0) since
the Unix Epoch (1970-01-01).
Usage
yearquarter(year = integer(), quarter = integer())

as_yearquarter(x, ...)

## Default S3 method:
as_yearquarter(x, ...)

## S3 method for class 'Date'
as_yearquarter(x, ...)

## S3 method for class 'POSIXt'
as_yearquarter(x, ...)

## S3 method for class 'character'
as_yearquarter(x, ...)

## S3 method for class 'factor'
as_yearquarter(x, ...)

new_yearquarter(x = integer())

is_yearquarter(xx)
Arguments
year |
Vector representing the year associated with
|
quarter |
Vector representing the quarter associated with
|
x, xx |
R objects. |
... |
Only used for character input where additional arguments are passed through
to |
Details
yearquarter() is a constructor for <grates_yearquarter> objects. It takes
a vector of year and a vector of quarter values as inputs. Length 1 inputs
will be recycled to the length of the other input and double vectors will
be converted to integer via as.integer(floor(x)).
as_yearquarter() is a generic for coercing input in to <grates_yearquarter>.
Character input is first parsed using
as.Date().POSIXct and POSIXlt are converted with their timezone respected.
new_yearquarter() is a minimal constructor for <grates_yearquarter>
objects aimed at developers. It takes, as input, the number of quarters
(starting at 0) since the Unix Epoch, that you wish to represent.
double vectors will again be converted to integer via as.integer(floor(x)).
Value
A <grates_yearquarter> object.
Examples
# date coercion
as_yearquarter(Sys.Date())
#> <grates_yearquarter[1]>
#> [1] "2025-Q1"
# POSIXt coercion
as_yearquarter(as.POSIXct("2019-03-04 01:01:01", tz = "America/New_York"))
#> <grates_yearquarter[1]>
#> [1] "2019-Q1"
# character coercion
as_yearquarter("2019-05-03")
#> <grates_yearquarter[1]>
#> [1] "2019-Q2"
# construction
yearquarter(year = 2000, quarter = 3)
#> <grates_yearquarter[1]>
#> [1] "2000-Q3"
# direct construction
d <- seq.Date(from = as.Date("1970-01-01"), by = "quarter", length.out = 4)
stopifnot(
    identical(
        as_yearquarter(d),
        new_yearquarter(0:3)
    )
)
Yearweek class
Description
Yearweeks start on a user defined day of the week and span a 7 day period. For yearweek objects the first week of a "year" is considered to be the first yearweek containing 4 days of the given calendar year. This means that the calendar year will sometimes be different to that of the associated yearweek object.
Internally, <grates_yearweek> objects are stored as the number of weeks
(starting at 0) from the date of the user-specified firstday nearest the
Unix Epoch (1970-01-01). That is, the number of seven day periods from:
- 1969-12-29 for `firstday` equal to 1 (Monday)
- 1969-12-30 for `firstday` equal to 2 (Tuesday)
- 1969-12-31 for `firstday` equal to 3 (Wednesday)
- 1970-01-01 for `firstday` equal to 4 (Thursday)
- 1970-01-02 for `firstday` equal to 5 (Friday)
- 1970-01-03 for `firstday` equal to 6 (Saturday)
- 1970-01-04 for `firstday` equal to 7 (Sunday)
Usage
yearweek(year = integer(), week = integer(), firstday = 1L)

as_yearweek(x, ...)

## Default S3 method:
as_yearweek(x, ...)

## S3 method for class 'Date'
as_yearweek(x, firstday = 1L, ...)

## S3 method for class 'POSIXt'
as_yearweek(x, firstday = 1L, ...)

## S3 method for class 'character'
as_yearweek(
  x,
  firstday = 1L,
  format,
  tryFormats = c("%Y-%m-%d", "%Y/%m/%d"),
  ...
)

## S3 method for class 'factor'
as_yearweek(
  x,
  firstday = 1L,
  format,
  tryFormats = c("%Y-%m-%d", "%Y/%m/%d"),
  ...
)

new_yearweek(x = integer(), firstday = 1L)

is_yearweek(xx)
Arguments
year |
Vector representing the year associated with
|
week |
Vector representing the week associated with 'year.
|
firstday |
The day the week starts on from 1 (Monday) to 7 (Sunday). |
x, xx |
R objects. |
... |
Other values passed to as.Date(). |
format |
Passed to as.Date() unless If not specified, it will try tryFormats one by one on the first non-NA
element, and give an error if none works. Otherwise, the processing is via
|
tryFormats |
Format strings to try if format is not specified. |
Details
yearweek() is a constructor for <grates_yearweek> objects. These are
weeks whose first day can be specified by the user. It takes a
vector of year and vector of week values as inputs. Length 1 inputs will be
recycled to the length of the other input and double vectors will again be
converted to integer via as.integer(floor(x)).
as_yearweek() is a generic for conversion to <grates_yearweek>.
Date, POSIXct, and POSIXlt are converted with the timezone respected.
Character objects are first coerced to date via
as.Date()unlessformat = "yearweek"in which case input is assumed to be in the form "YYYY-Wxx" and parsed accordingly.
new_yearweek() is a minimal constructor for <grates_yearweek> objects
aimed at developers. It takes, as input, the number of weeks since the
user-specified firstday nearest the Unix Epoch. double vectors
will be converted to integer via as.integer(floor(x)).
Value
A <grates_yearweek> object with subclass corresponding to the first day of
the week they represent (e.g. <grates_yearweek_monday>).
See Also
new_isoweek() and new_epiweek().
Examples
# date coercion
as_yearweek(Sys.Date())
#> <grates_yearweek_monday[1]>
#> [1] "2025-W11"
# POSIXt coercion
as_yearweek(as.POSIXct("2019-03-04 01:01:01", tz = "America/New_York"))
#> <grates_yearweek_monday[1]>
#> [1] "2019-W10"
# character coercion with Friday as the first day of the week
as_yearweek("2019-05-03", firstday = 5) # first day is Friday
#> <grates_yearweek_friday[1]>
#> [1] "2019-W18"
# character coercion in yearweek format
as_yearweek("2019-W12", format = "yearweek")
#> <grates_yearweek_monday[1]>
#> [1] "2019-W12"
# construction
yearweek(year = 2000, week = 3)
#> <grates_yearweek_monday[1]>
#> [1] "2000-W03"
# direct construction
stopifnot(
    identical(
        new_yearweek(0:1, firstday = 1),
        as_yearweek("1969-12-29", firstday = 1) + 0:1
    )
)