Method for dplyr::mutate that implicitly accounts for the inherent grouping structure of incidence2 objects.
Arguments
- .data
An incidence2 object.
- ...
<
data-masking> Name-value pairs. The name gives the name of the column in the output.The value can be:
A vector of length 1, which will be recycled to the correct length.
A vector the same length as the current group (or the whole data frame if ungrouped).
NULL, to remove the column.A data frame or tibble, to create multiple columns in the output.
- .by
Not used as grouping structure implicit.
- .keep
Control which columns from
.dataare retained in the output. Grouping columns and columns created by...are always kept."all"retains all columns from.data. This is the default."used"retains only the columns used in...to create new columns. This is useful for checking your work, as it displays inputs and outputs side-by-side."unused"retains only the columns not used in...to create new columns. This is useful if you generate new columns, but no longer need the columns used to generate them."none"doesn't retain any extra columns from.data. Only the grouping variables and columns created by...are kept.
- .before, .after
<
tidy-select> Optionally, control where new columns should appear (the default is to add to the right hand side). Seerelocate()for more details.
Value
A modified incidence2 object if the necessary invariants are preserved, otherwise a tibble.
See also
dplyr::mutate for the underlying generic.
Examples
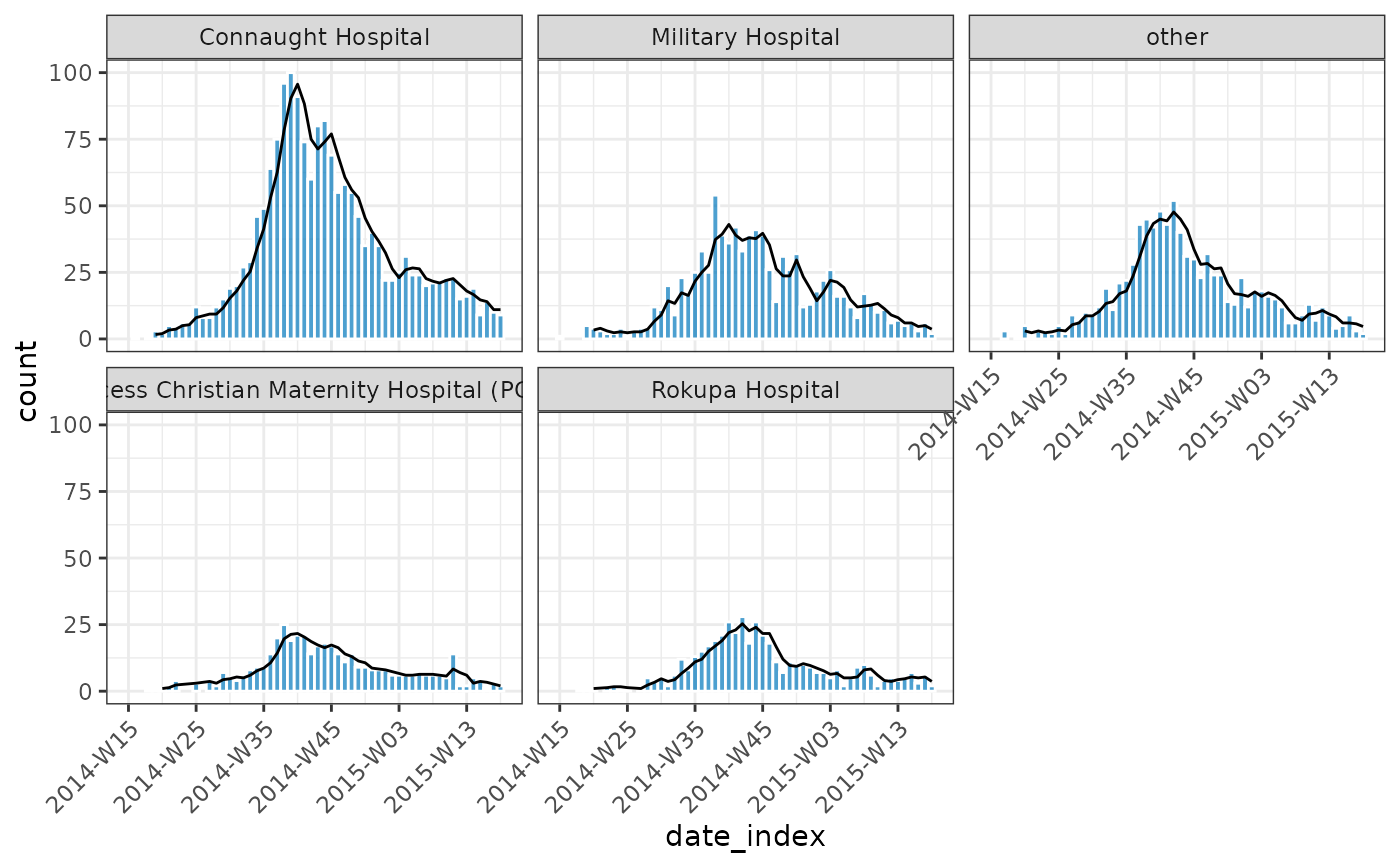
if (requireNamespace("outbreaks", quietly = TRUE) && requireNamespace("ggplot2", quietly = TRUE)) {
    data(ebola_sim_clean, package = "outbreaks")
    ebola_sim_clean$linelist |>
        subset(!is.na(hospital)) |>
        incidence_(date_of_onset, hospital, interval = "isoweek") |>
        mutate(ave = data.table::frollmean(count, n = 3L, align = "right")) |>
        plot(border_colour = "white", angle = 45) +
        ggplot2::geom_line(ggplot2::aes(x = date_index, y = ave))
}
#> Warning: Removed 2 rows containing missing values or values outside the scale range
#> (`geom_line()`).